TDK-Lambda Americas Blog
Comparing Power Supply MTBF Numbers
MTBF
General Information
RWS-B
September 1, 2016
One subject that confuses specifiers of power supplies is comparing MTBF numbers from different manufacturers, who often use different standards for calculating the number of hours. There are many well written articles available on the internet that go into great detail on the calculation of MTBF, but this blog article will attempt to simplify things.
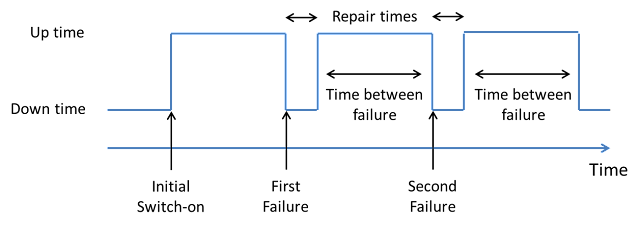
MTBF (Mean Time Between Failures) is the mean time between successive failures, and only really applies to a part that will be repaired and returned to service. So if the up-time of the power supply was a year in each case below, then the MTBF would be ½ x (1 year + 1 year).
A low cost power supply will probably not be repaired and if it is under warranty, it will normally be replaced. In this case, the numbers to look for would be MTTF (Mean Time To Failure), but that figure is not widely stated. Usually life testing of a large number (to cut the test time down) of power supplies is used to calculate that.
The MTBF number is often thought to be the minimum (guaranteed) time before a failure; that is certainly not the case! Reliability “R” is based on the probability that a piece of equipment, in our case a power supply, will operate satisfactorily for a given time period “t” (based on specified conditions – for example ambient temperature and output load).
For random failures, the probability that a power supply will survive to its calculated MTBF is just 37%, no matter what the MTBF number is:
R(t) = e–t / MTBF = e-1 = 0.368 (when t = the MTBF number)
To complicate things further, a variety of methods are used to calculate MTBF.
| Prediction Standard | Applications | Disadvantages |
|---|---|---|
| MIL-HDBK-217F | Provides failure rate data and stress models for parts count and parts stress predictions. It also provides models for many environments ranging from ground benign to projectile launch | Hasn’t been updated since 1995, gives higher failure rates of commercial parts than is seen in actual product life |
| Telcordia SR332 | Gives three prediction methods based on parts count, lab testing and field life | Narrow ambient temperature range |
| RCR-9102 | Produced by JEITA - Japan Electronics and Information Technology Industries Association. In each update component failure rates (FIT) have been changed, particularly fans |
Issued in 1994, based on MIL-HDBK-217F |
| RCR-9102A | Issued in 2000, based on MIL-HDBK-217F (Notice 2). Includes SMT parts & pcbs | |
| RCR-9102B | Issued in 2006 |
Usually for commercial power supplies, the figures are calculated at 25°C, ground benign or fixed.
Taking TDK-Lambda’s RWS-B series as an example, the calculated numbers are as follows:
| RCR-9102 | 444,089 hours |
| RCR-9102B | 218,172 hours |
| Telcordia | 2,235,743 hours Ta=25°C |
| Telcordia | 1,063,230 hours Ta=40°C |
It can be seen from the above numbers, that there is a 10-fold difference between RCR-9102B and Telcordia, and more than a 2 fold difference between RCR-9102 and RCR-9102B. Several customers have asked why our newer products calculated using the JEITA method appeared to be less reliable than older products, but did not know the significant impact of the updated, harsher standard.
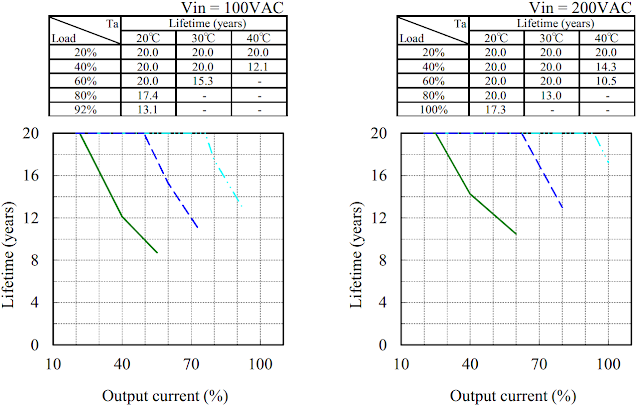
Engineers should be more concerned about electrolytic capacitor and fan life (if used) as these are the typical failure modes. Many manufacturers are showing expected capacitor lifetimes in their reliability reports. Below are the plots for the RWS150B, which was designed for long capacitor life. As a note, some manufacturers show similar plots, but state in small print that the convection cooled power supplies had external forced air cooling applied.